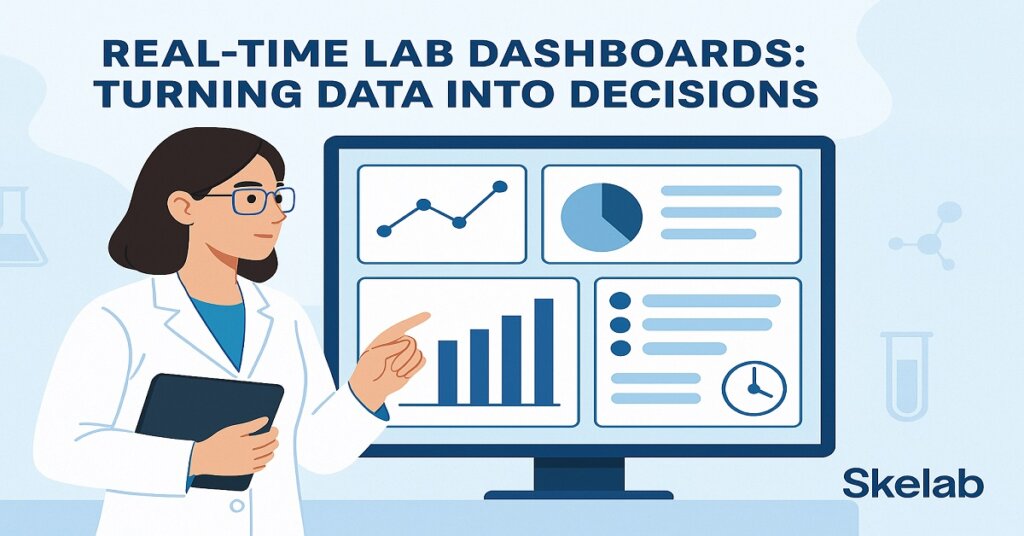
Real-Time Lab Dashboards: Turning Data into Decisions
In the digital age of diagnostics, speed is critical—but clarity is king.
Your lab might be processing hundreds or even thousands of tests per day, but without a clear view of what’s happening across your operations in real time, you’re flying blind. That’s where real-time lab dashboards come in—not just as visual tools, but as decision-making engines.
At Skelab, we’ve built dashboards designed for action. Because data alone isn’t power—actionable data is.
👀 What is a Real-Time Lab Dashboard?
A lab dashboard is a centralized, visual interface that provides live insights into lab operations, including:
- Sample processing times
- Pending and completed test volumes
- Instrument usage
- Technician workloads
- Abnormal result flags
- Inventory levels and alerts
But more than just charts and tables, a well-designed dashboard tells a story—one that lab managers, technologists, and clinicians can act on immediately.
🧠 Why Real-Time Visibility Matters
Traditional lab reports are static. You see them after something has already happened—too late to prevent a delay or correct an error.
Real-time dashboards give you the power to react instantly, helping you:
- 🔍 Spot and fix bottlenecks on the fly
- ⚠️ Identify critical results that need escalation
- ⏳ Monitor turnaround time (TAT) in live shifts
- 📈 Optimize staff and instrument allocation
- 🧾 Track compliance and quality metrics for audits
With Skelab, this isn’t just possible—it’s built in.
⚙️ What Skelab Dashboards Let You Do
1. Monitor Lab Performance KPIs in Real Time
Track key metrics like:
- Average TAT by test or department
- % of urgent tests completed within SLA
- Daily test volume vs capacity
🟢 Color-coded indicators show if you’re on track—or need to intervene.
2. Track Critical Results as They Happen
Skelab alerts you visually (and optionally via notifications) when:
- A result exceeds a clinical threshold
- An urgent sample is approaching deadline
- A flagged patient needs clinician attention
👩⚕️ Empower faster clinical decision-making.
3. Balance Staff Workloads
See live data on how many samples are assigned to each technologist or station.
✅ Helps avoid overload
✅ Reduces turnaround delays
✅ Supports fair resource allocation
4. Drill Down on Errors or Delays
If something goes wrong—like a delayed test—you can quickly trace:
- Which department handled it
- Which machine was used
- Who verified it
- When it was processed
🔎 Transparency fuels accountability.
5. Forecast Trends and Resources
Use Skelab’s data visualization to:
- Predict testing surges (e.g., flu season)
- Schedule staff accordingly
- Manage reagent inventory before it runs low
🗓️ Turn operational data into forecasting intelligence.
🌐 Who Benefits?
- Lab Managers: Stay in control of lab operations 24/7
- Quality Officers: Monitor and prove compliance
- Clinicians: Get quicker access to key test updates
- Executives: View lab performance and cost-efficiency at a glance
Dashboards turn your lab into a real-time command center.
❤️ Final Thought
In today’s fast-paced healthcare environment, you don’t have time to wait for end-of-day reports. With Skelab’s real-time dashboards, you can lead with clarity, confidence, and agility—turning raw data into smarter decisions and better patient care.
Because in the lab, what you can see is what you can improve.